
How Melting Ice Changes Earth’s Reflectivity
TLDR
Ice albedo feedback is an amplifying process. Initial warming melts or darkens reflective snow and ice, exposing darker land, water or melt ponds. Those surfaces absorb more sunlight, which adds local warming and can promote further melting. The effect is measurable, but its strength depends on location, season, cloud cover, snow conditions and interactions among the atmosphere, ocean and ice. It does not mean that polar warming must become an unstoppable runaway process.
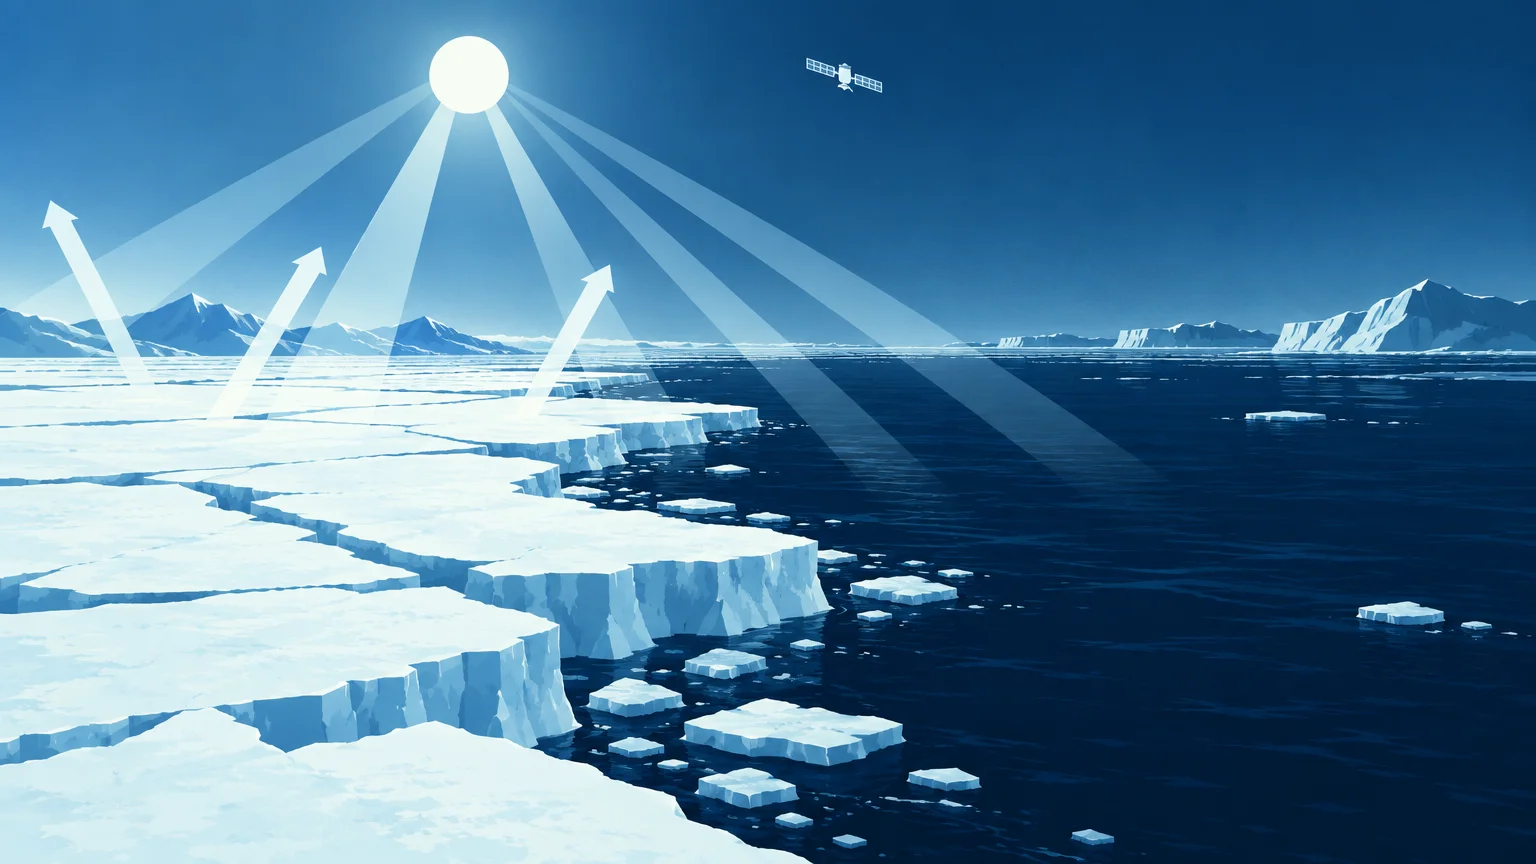
The simplest version of ice albedo feedback explained is a change in Earth’s surface energy balance: replace a bright surface with a dark one, and more incoming solar energy remains in the climate system instead of being reflected to space. This is one reason warming can be amplified in snowy and icy regions. The IPCC identifies losses of snow and sea ice as an amplifying surface-albedo feedback, while also emphasizing that several other processes contribute to polar warming. The IPCC assessment of Earth’s energy budget and climate feedbacks provides the wider scientific context.
Ice albedo feedback explained step by step
Albedo is the fraction of incoming radiation that a surface reflects. It is often expressed on a scale from zero to one, although it can also be written as a percentage. A higher value indicates greater reflectivity. Fresh snow is bright and highly reflective; open ocean, bare ground and vegetation are generally darker and absorb a larger share of incoming sunlight.
- An initial change, such as warmer air or ocean water, promotes melting or reduces the duration of snow and ice cover.
- The surface becomes darker as snow thins, ice retreats, melt ponds form or bare land and open ocean appear.
- The darker surface reflects less shortwave solar radiation and absorbs more of it.
- The added energy warms the surface and nearby environment, making additional melting or delayed refreezing more likely.
- Further surface darkening can repeat and strengthen the cycle while sunlight and meltable snow or ice remain available.
In climate terminology, this is a positive feedback. “Positive” describes the direction of the response, not whether the outcome is beneficial. The feedback amplifies an initial temperature change; it does not create energy, and it is not the original cause of modern global warming. Greenhouse gases alter Earth’s energy balance first, while feedbacks determine how strongly the climate responds.
The surface being uncovered matters
“Ice albedo feedback” is useful shorthand, but several related surface changes sit under that label. They do not have identical effects.
| Surface change | Why absorption changes | Important caveat |
|---|---|---|
| Snow-covered land to bare ground or vegetation | The exposed surface is usually darker than snow and absorbs more sunlight. | The effect depends on snow depth, vegetation, soil moisture, season and the angle of the Sun. |
| Snow-covered glacier or ice sheet to bare ice | Bare ice is generally darker than fresh snow, so more solar energy is absorbed. | Dust, soot, algae, refrozen layers and surface roughness can also alter reflectivity. |
| Sea ice to open ocean | Dark ocean absorbs more sunlight than a bright, snow-covered ice surface. | Clouds, waves, Sun angle and the timing of ice loss affect the resulting energy change. |
| Bright ice to melt ponds | Water collecting on the ice darkens part of its surface before the ice disappears. | Pond coverage and depth can vary substantially across an ice pack and through the season. |
| Land ice to exposed rock or water | Loss of reflective ice can increase local absorption while meltwater enters the ocean. | Unlike floating sea ice, melting land ice directly contributes to sea-level rise. |
That last distinction prevents a common misunderstanding. Floating sea ice already displaces seawater, so its melting has little direct effect on sea level. Melting glaciers and ice sheets transfer water stored on land into the ocean and therefore raise sea level. Sea-ice loss still matters greatly for reflectivity, ecosystems and exchanges of heat and moisture between ocean and atmosphere.
Why the feedback is seasonal
The direct albedo mechanism requires sunlight. During polar night, replacing reflective ice with dark water does not immediately increase absorption of solar radiation because little or no sunlight is available. The direct effect becomes important during the sunlit melt season, particularly when an early loss of snow or ice leaves a dark surface exposed for weeks or months.
Timing can therefore matter as much as area. A patch of open water appearing early in summer has more opportunity to absorb sunlight than an equivalent patch appearing near autumn. Energy stored in the upper ocean can subsequently delay ice formation and affect heat transferred back to the atmosphere. This is one reason a map of minimum ice extent alone cannot describe the full energy-budget effect.
What satellites measure—and what they do not
Sea-ice extent, sea-ice concentration and albedo are related but distinct measurements. Concentration estimates how much of a grid cell is covered by ice. Extent usually counts the area of grid cells meeting a specified ice-concentration threshold. Albedo describes reflected radiation. A decline in extent often exposes dark ocean, but an extent record does not directly measure how much sunlight was reflected or absorbed.
The National Snow and Ice Data Center’s Sea Ice Index provides Arctic and Antarctic extent and concentration products from November 1978 onward. It is based on passive-microwave satellite observations, which can be collected through cloud cover and during polar darkness. That makes the method valuable for maintaining a consistent long-term ice record.
Passive-microwave sensors identify differences in microwave emissions from ice and open water; they do not directly observe visible brightness in the same way a camera does. Scientists studying the feedback therefore combine several kinds of evidence: ice concentration and extent, reflected shortwave radiation measured from satellites, field measurements of snow and ice properties, melt-pond observations, cloud records and models of energy transfer.
Time averaging also matters. NSIDC advises that monthly Sea Ice Index values are generally more suitable than daily values for long-term trend analysis because averaging reduces short-term weather variability and daily measurement error. A dramatic daily map can describe a particular event, but it is usually weaker evidence for a multidecadal climate trend.
What observational evidence shows
A satellite-based study by Pistone, Eisenman and Ramanathan examined Arctic planetary albedo over 1979–2011. The researchers reported a decline from 0.52 to 0.48 and estimated that the change was associated with an additional 6.4 ± 0.9 watts per square metre of solar energy entering the Arctic Ocean region over the study period. The study’s published record describes its observational method and result.
Those numbers should be read with their boundaries intact. They are an estimate for a defined Arctic region, dataset and period—not a universal feedback strength that can be applied unchanged to every latitude, season or future year. “Planetary albedo” also includes the influence of the atmosphere and clouds, not just the brightness of the physical surface.
The study is useful because it connects changing ice cover to a radiation measurement rather than relying only on an intuitive bright-versus-dark comparison. It demonstrates the evidentiary chain scientists seek: observe a surface change, measure a corresponding change in reflected energy and quantify the uncertainty around the estimate.
Ice loss is one part of Arctic amplification
The Arctic has warmed faster than the global average, a pattern called Arctic amplification. Sea-ice and snow-albedo feedbacks contribute to this pattern, but they are not a complete explanation. The IPCC also identifies the vertical structure of atmospheric warming, changes in heat transport, ocean heat storage and other feedbacks as important parts of the response.
Clouds are especially complicated because they can influence both incoming sunlight and outgoing heat. A cloud may reflect solar radiation that would otherwise reach the surface, while also reducing the loss of infrared energy to space. Its net effect depends on cloud height, thickness, composition, season and the brightness of the surface below. Research evaluating Arctic cloud and radiation processes identifies cloud representation as an important source of uncertainty in estimates of regional climate feedbacks.
Other details also affect how much energy is absorbed and where it goes. Snow can insulate sea ice while making its upper surface brighter. Thin ice generally responds more quickly to weather and ocean heat than thick ice. Winds can push ice together or pull it apart, while ocean mixing can carry absorbed heat away from the surface. These processes interact, so no single ice-area measurement captures the complete response.
Does positive feedback mean runaway warming?
No. A positive feedback amplifies change, but amplification is not automatically unlimited or irreversible. Feedback strength can vary as seasons and physical conditions change, and stabilizing processes can operate at the same time.
For Arctic sea ice specifically, the IPCC reports with high confidence that no global-mean-temperature threshold has been identified beyond which summer sea-ice loss becomes self-accelerating and irreversible. Winter brings little sunlight and strong heat loss from exposed ocean, creating stabilizing influences that counter the summer albedo feedback. This assessment does not make sea-ice loss harmless or instantly reversible; it means the evidence does not support describing summer sea-ice decline as a simple runaway switch.
How to evaluate a claim about ice and reflectivity
When a chart or headline attributes warming to ice-albedo feedback, check whether its evidence matches the claim. A useful review takes only a few questions:
- Which surface changed: seasonal snow, sea ice, a glacier, an ice sheet or melt ponds?
- Is the chart showing extent, concentration, thickness, surface albedo or radiation measured at the top of the atmosphere?
- What geographical region and time period are covered?
- Does the analysis account for the season and available sunlight?
- Is a regional result being presented incorrectly as a global value?
- Are clouds, snow cover and other interacting processes included or explicitly excluded?
- Does an uncertainty range accompany a precise estimate?
- Is “positive feedback” being confused with an inevitable runaway tipping point?
These questions separate the dataset from its interpretation. A sea-ice map can establish where ice was detected under a stated method. A radiation instrument can estimate reflected or absorbed energy. A model or statistical analysis is then needed to connect those observations, account for other influences and estimate the feedback’s contribution to temperature change.
The practical takeaway
The core physics is straightforward: bright snow and ice reflect substantial sunlight, while darker ocean and land absorb more. Losing reflective cover can therefore add energy to a region and amplify an initial warming trend. Observations show that this is not merely a classroom analogy; changes in Arctic reflectivity and absorbed solar energy have been measured.
The magnitude is not one fixed global number. It changes with the surface, latitude, season, cloud conditions, snow state, ice thickness and ocean-atmosphere response. When reading a claim, look for measurements of both the changing ice or snow cover and the resulting radiation balance. That is the difference between recognizing a plausible mechanism and demonstrating how strongly it operated in a particular place and period.
References
- Chapter 7: The Earth’s Energy Budget, Climate Feedbacks, and Climate Sensitivity | Climate Change 2021: The Physical Science Basis
- Sea lce – NASA Science
- Sea Ice Index, Version 3 | National Snow and Ice Data Center
- About the data | National Snow and Ice Data Center
- Observational determination of albedo decrease caused by vanishing Arctic sea ice.
- Clouds and Radiation Processes in Regional Climate Models Evaluated Using Observations Over the Ice‐free Arctic Ocean – Inoue – 2021 – Journal of Geophysical Research: Atmospheres – Wiley Online Library
- Chapter 9: Ocean, Cryosphere and Sea Level Change | Climate Change 2021: The Physical Science Basis