
A Beginner’s Checklist for Evaluating a Climate Graph Online
A practical checklist for determining what an online climate graph measures, how it was constructed and whether the claim attached to it follows from the evidence.
A practical checklist for determining what an online climate graph measures, how it was constructed and whether the claim attached to it follows from the evidence.

Paleoclimate evidence extends climate records beyond modern instruments. Learn how scientists measure, date, combine and test natural archives.
Climate models are not intended to predict the exact weather on a particular day decades from now. They estimate how climate statistics change under specified conditions—and must be evaluated accordingly.
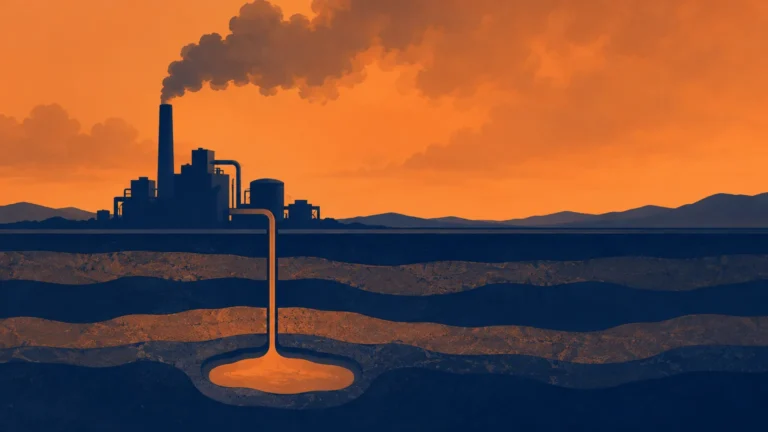
Carbon capture can help address selected industrial emissions and provide durable carbon removal, but only with full-system accounting, verified storage and continued emissions cuts.

A practical framework for comparing printers for science posters, exhibits, handouts and QR labels without mistaking a low quote for the best result.
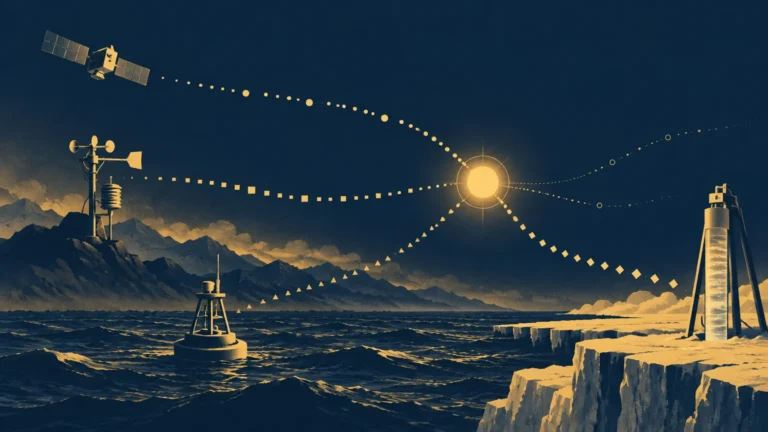
A scientific consensus is a conclusion supported by converging evidence, not a vote that settles every question. Here is how climate consensus is built and tested.

Climate analogies can clarify accumulation, energy balance, risk and delayed response—but only when communicators identify where each comparison stops working.
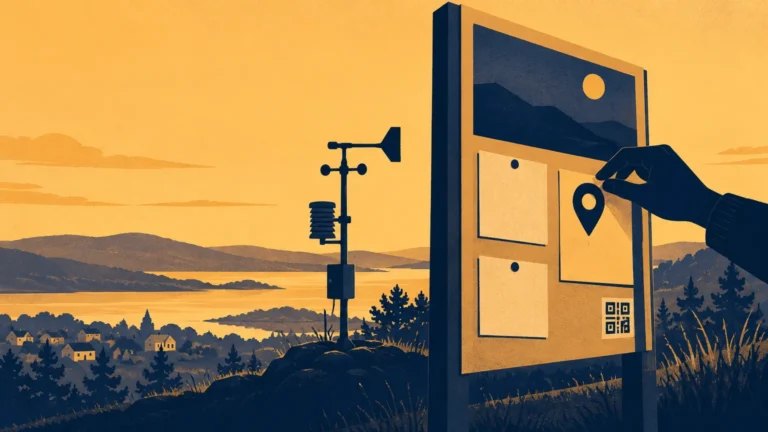
A practical guide to turning one local climate question into a credible exhibit with named data, transparent methods, clear limitations, and useful interaction.
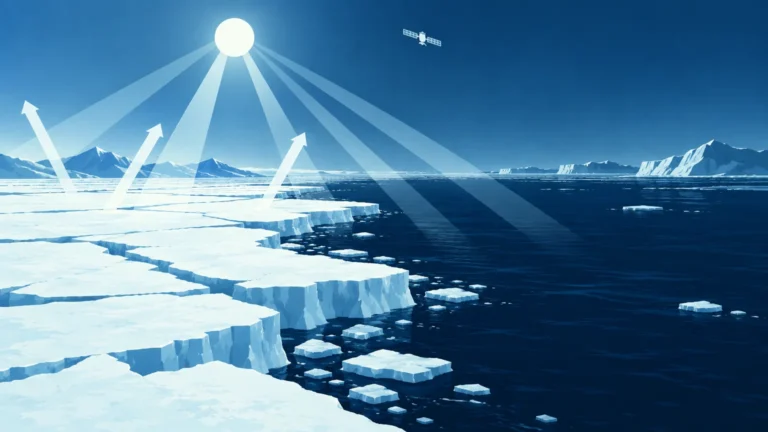
Melting snow and ice expose darker land or ocean, allowing more sunlight to be absorbed. Here is how that feedback works, how scientists measure it, and what it does not mean.

Climate downscaling turns broad global projections into regional information. Here is how dynamical and statistical methods work—and how to judge their limits.