Paleoclimate: How Past Climates Help Test Climate Science
TLDR: Paleoclimate evidence is the physical, chemical and biological information preserved in ice, trees, corals, caves and sediments. Scientists measure these archives, establish their ages, calibrate climate-sensitive indicators and compare multiple independent records. The result is not a perfect recording of every past year, but a tested reconstruction with stated limits and uncertainties.
The phrase paleoclimate evidence climate can sound like a collection of keywords, but it points to a practical question: how can scientists know what climate was like before thermometers, ocean buoys and satellites? The answer is to examine natural archives that responded to temperature, rainfall, atmospheric composition, ocean conditions and other environmental changes. These records extend climate knowledge far beyond the instrumental era.
What counts as paleoclimate evidence?
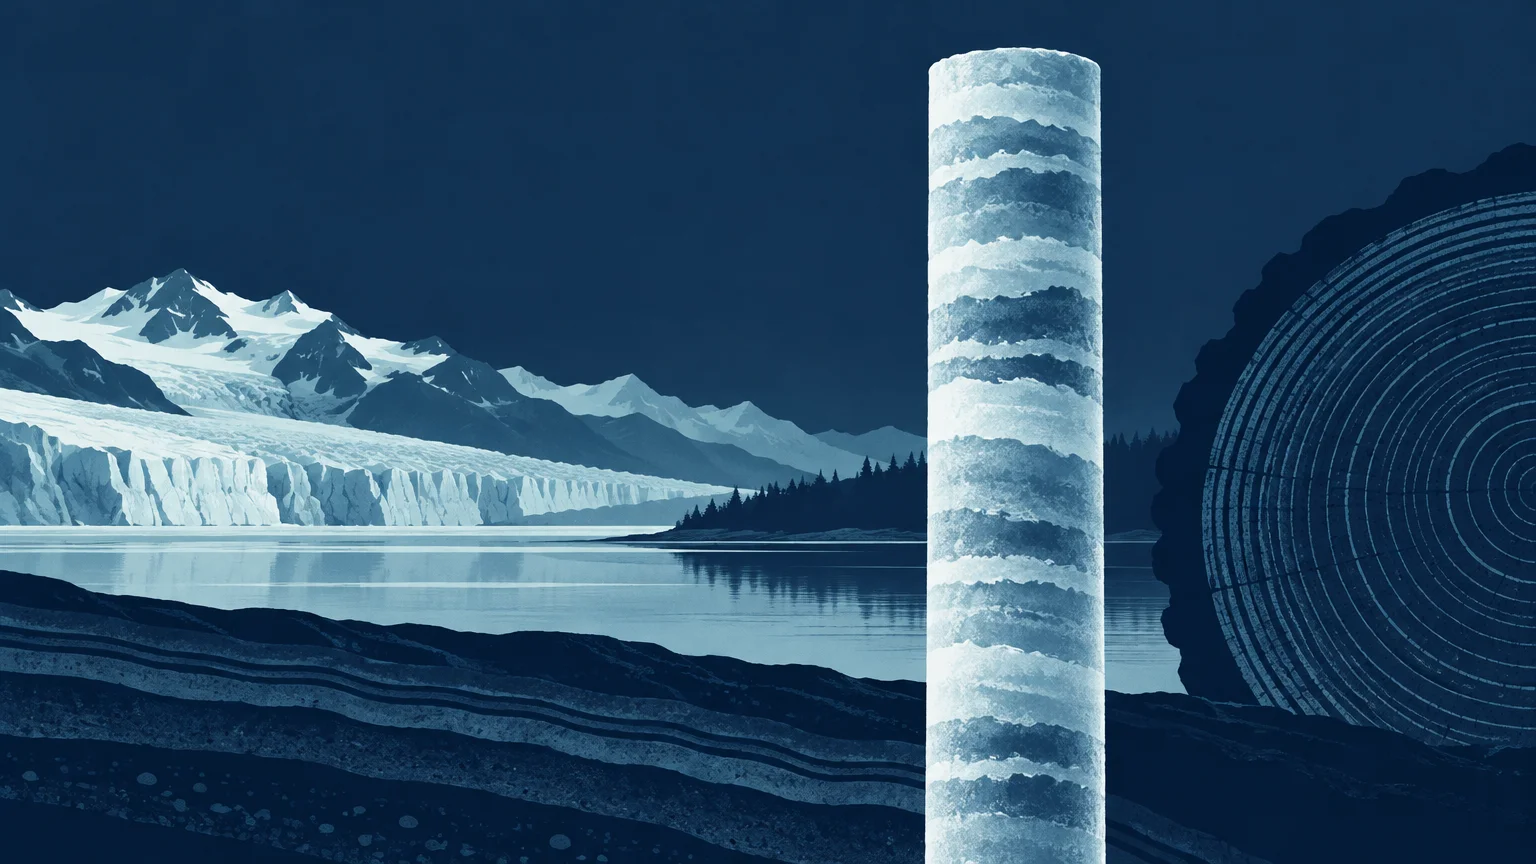
Paleoclimatology studies past climates using preserved evidence and reconstructed climate variables. Major archives include tree rings, ice cores, corals, cave deposits and lake or ocean sediments. Some provide relatively detailed records of recent centuries; others reach hundreds of thousands or millions of years into the past. NOAA maintains an overview and data access through its paleoclimatology resources.
It is important to distinguish a measurement from its interpretation. Air bubbles sealed in ice can contain samples of an earlier atmosphere, allowing scientists to measure the gases in that trapped air. An oxygen-isotope ratio, tree-ring width or change in fossil plankton is different: it is a measured property that must be interpreted as an indicator, or proxy, of environmental conditions.
A proxy is not therefore a guess. It is an observable quantity whose relationship with climate is studied through physical principles, modern observations, laboratory work or comparisons with other records. The strength of an inference depends on how specifically the proxy responds to the climate variable being reconstructed and how well other influences are accounted for.
How natural archives differ
| Archive | What is measured | Possible climate information | Main limitation |
|---|---|---|---|
| Ice cores | Trapped gases, isotopes, dust and deposited chemicals | Atmospheric composition, temperature-related signals and environmental conditions | Ice flow, dating and local conditions affect interpretation |
| Tree rings | Ring width, density and chemical composition | Growing-season temperature or moisture at annual resolution in suitable locations | Growth can respond to several factors and reflects a particular season and place |
| Corals | Growth bands and skeletal chemistry | Sea-surface conditions and ocean changes | Records are geographically limited and may contain growth gaps |
| Cave deposits | Mineral layers, isotopes and trace elements | Rainfall, moisture sources and regional circulation | Dating and climate interpretation vary among caves |
| Lake and ocean sediments | Layer properties, fossils, pollen and chemical indicators | Temperature, ecosystems, ice conditions and circulation over long periods | Mixing and slow accumulation can blur short-lived changes |
| Documentary records | Written observations such as harvest dates or freezing events | Regional seasonal conditions during historical periods | Coverage and reporting practices are uneven |
No single core, tree or coral should be treated as a global thermometer. A tree may primarily record summer moisture at one site, while a marine sediment core may average conditions over centuries in one ocean basin. Readers interested in the annual but conditional nature of dendroclimatology can see what tree rings measure well as climate proxies.
The evidence chain from archive to reconstruction
A paleoclimate reconstruction is built through a sequence of linked decisions. Each link can be examined rather than accepted as a black box.
- Collect and document the archive. Researchers record its location, physical setting, depth or growth structure and possible disturbances.
- Measure a physical, chemical or biological property. Examples include gas concentration, isotope ratios, ring dimensions or fossil assemblages.
- Build a chronology. Annual layers can sometimes be counted, while other records require radiometric dates, recognizable marker layers or age models that combine several constraints.
- Relate the measurement to climate. Where records overlap with observations, researchers can test whether a proxy tracks temperature, moisture or another variable as expected.
- Estimate uncertainty. Dating error, measurement error, calibration choices, spatial coverage and unexplained variability can all affect the result.
- Compare independent evidence. Agreement among different archives, regions and methods is more persuasive than one isolated series.
- Test physical consistency. Reconstructions can be compared with known climate forcings and simulations, while mismatches can reveal problems in the data, chronology, interpretation or model.
Why paleoclimate reconstructions can disagree
Two reconstructions can differ without one being fraudulent or useless. They may cover different regions, seasons or climate variables. One record may resolve individual years but span only centuries; another may reach deep into geological time while smoothing changes across long intervals. Chronological uncertainty also tends to matter more when layers cannot be counted year by year.
The right response is to examine whether the records should agree in the first place. Compare their locations, units, baseline periods, time resolution and uncertainty ranges. A regional rainfall reconstruction should not be judged as though it were a global annual temperature series.
How past climates test models and climate physics
The Last Glacial Maximum, approximately 19,000 to 23,000 years ago, is a useful test case. Ice sheets were much larger, greenhouse-gas concentrations differed and vegetation and sea level were not the same as today. Researchers can combine proxy evidence with estimates of those boundary conditions, then examine whether climate simulations reproduce the broad pattern and magnitude of change. The IPCC assesses this period by integrating geological records, physical understanding, observations and model simulations rather than relying on one reconstruction.
A 2020 Nature study by Jessica Tierney and colleagues illustrates this approach: the researchers combined proxy data assimilation with climate modeling to reassess glacial cooling and constrain climate sensitivity. It is one contribution to a larger evidence base, not a single definitive answer.
Other periods test different conditions. The IPCC assessed the warmest long-term interval of the Last Interglacial, around 125,000 years ago, as 0.5°C to 1.5°C warmer than the 1850–1900 average, with medium confidence. The IPCC also concluded with high confidence that atmospheric carbon dioxide concentrations in 2019 were higher than at any time in at least two million years.
What paleoclimate evidence can and cannot establish
Past records show that climate varies naturally, responds to changing forcings and can undergo large shifts involving ice, oceans, ecosystems and sea level. They also provide out-of-sample tests: a model intended to represent climate physics should be able to explain more than the period used to tune or evaluate it.
But a past warm or cold interval is not an exact preview of the future. Continental positions, ice sheets, orbital conditions, greenhouse gases and the pace of change can differ. Paleoclimate evidence also does not establish the cause of modern warming by itself. That conclusion requires the combined evidence from modern observations, forcing estimates, physical theory, attribution studies and models.
A checklist for reading a paleoclimate chart
- What was physically measured, and what climate variable is inferred from it?
- How was the record dated, and how large is the age uncertainty?
- Does it represent one location, a region or a broader reconstruction?
- Which season or part of the environment is most strongly represented?
- What is the time resolution: annual, decadal, centennial or longer?
- Are uncertainty intervals shown, and do they include dating as well as calibration uncertainty?
- Were independent records used for replication or validation?
- Does the headline make a global claim from a local record?
- Are different baselines, averaging windows or units being compared fairly?
The practical takeaway
Read paleoclimate evidence as a chain, not as an iconic graph. Start with the material that was sampled, follow how it was dated and interpreted, and then ask whether independent archives and climate physics support the same conclusion. Strong paleoclimate findings do not depend on a proxy being perfect. They depend on transparent methods, quantified uncertainty and multiple lines of evidence surviving serious attempts to test them.
References
- Paleoclimatology | National Centers for Environmental Information (NCEI)
- www.ncei.noaa.gov
- www.ncei.noaa.gov
- Chapter 2: Changing State of the Climate System | Climate Change 2021: The Physical Science Basis
- www.ipcc.ch
- Glacial cooling and climate sensitivity revisited | Nature
- Approved Version Summary for Policymakers IPCC AR6 WGI